LoRaWAN Communication Debug
1. Join process page check
These pages are useful to check what is wrong on the Join process. Below shows the four steps that we can check the Join Process.
If user has checked below steps and still can't solve the problem, please send us (support@dragino.com) the sceenshots for each step to check. They include:
-
End node console to show the Join freuqency and DR. (If possible)
-
Gateway (from gateway UI) traffic to show the packet got from end node and receive from Server. (If possible)
-
Gateway traffic (from server UI) to shows the data exchange between gateway and server. (Normaly possible)
-
End Node traffic (from server UI) to shows end node activity in server. (Normaly possible)
-
End Node Keys screen shot shows in end node and server. so we can check if the keys are correct. (In most case, we found keys doesn't match, especially APP EUI)
1. End Device Join Screen shot, we can check:
-
If the device is sending join request to server?
-
What frequency the device is sending?
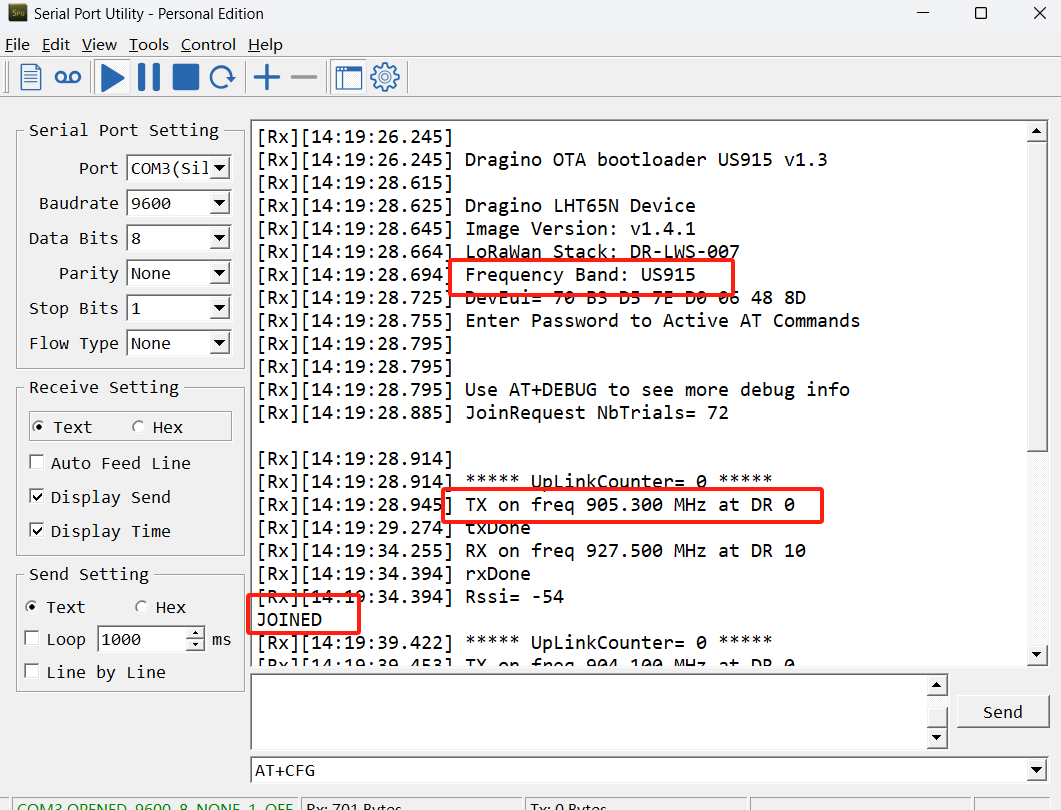
Console Output from End device to see the transmit frequency.
2. Gateway packet traffic in gateway web or ssh. we can check:
-
If the gateway receive the Join request packet from sensor? (If this fail, check if the gateway and sensor works on the match frequency)
-
If the gateway gets the Join Accept message from server and transmit it via LoRa?
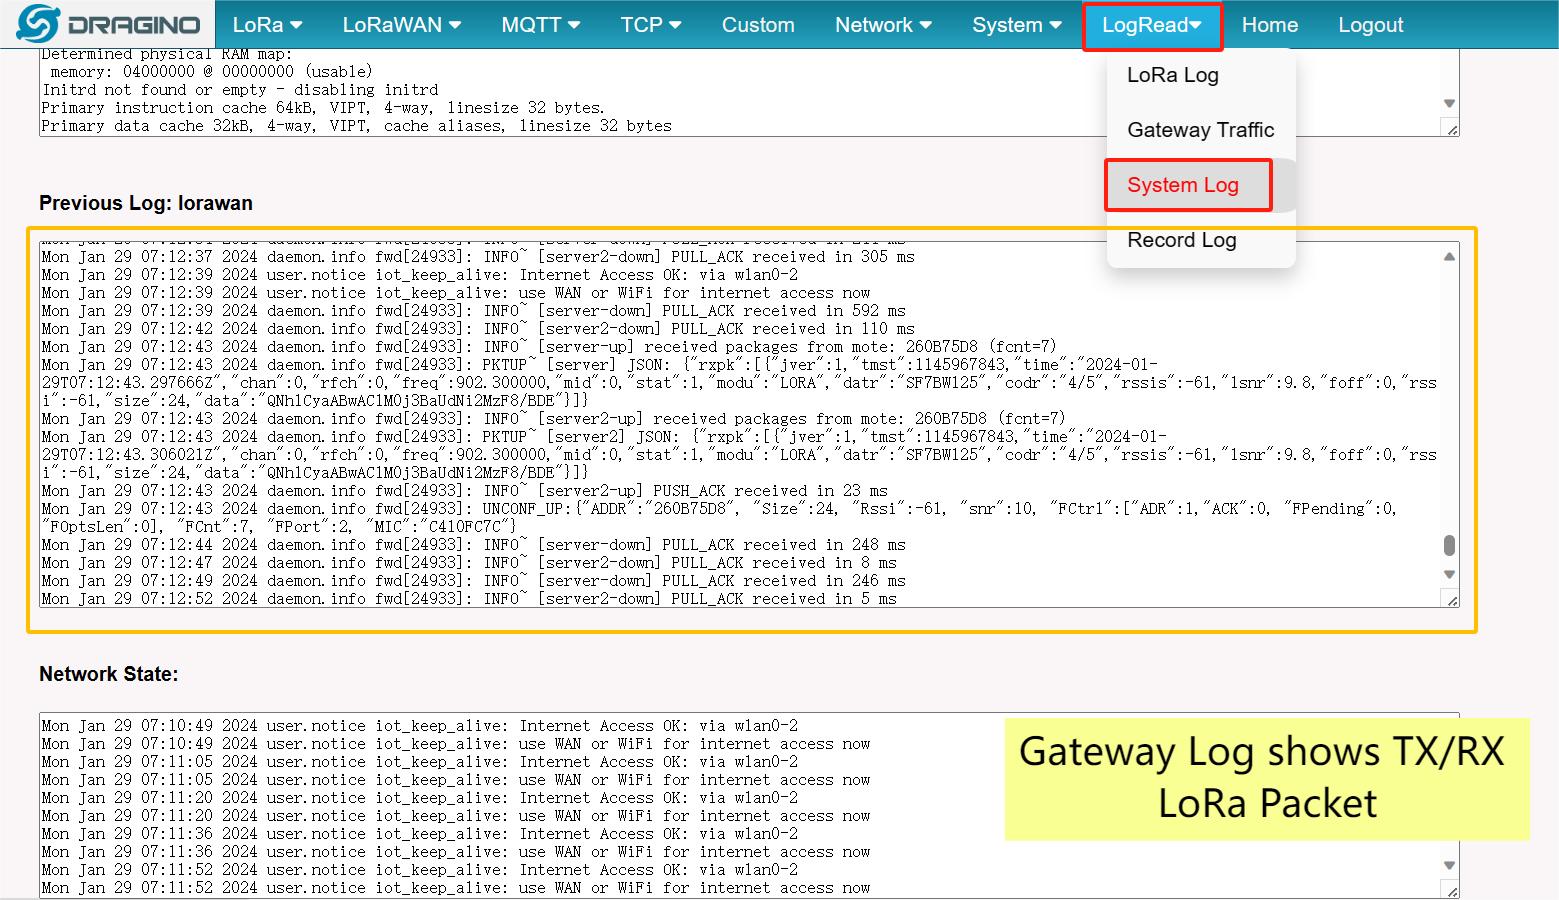
Console Output from Gateway to see packets between end node and server.
3. Gateway Live data in LoRaWAN Server
-
Does the gateway real-time data contain information about Join Request? If not, check the internet connection and gateway LoRaWAN server Settings.
-
Does the server send back a Join Accept for the Join Request? If not, check that the key from the device matches the key you put into the server, or try to choose a different server route for that end device.
-
If the Join Accept message are in correct frequency? If you set the server to use:
US915、EU868
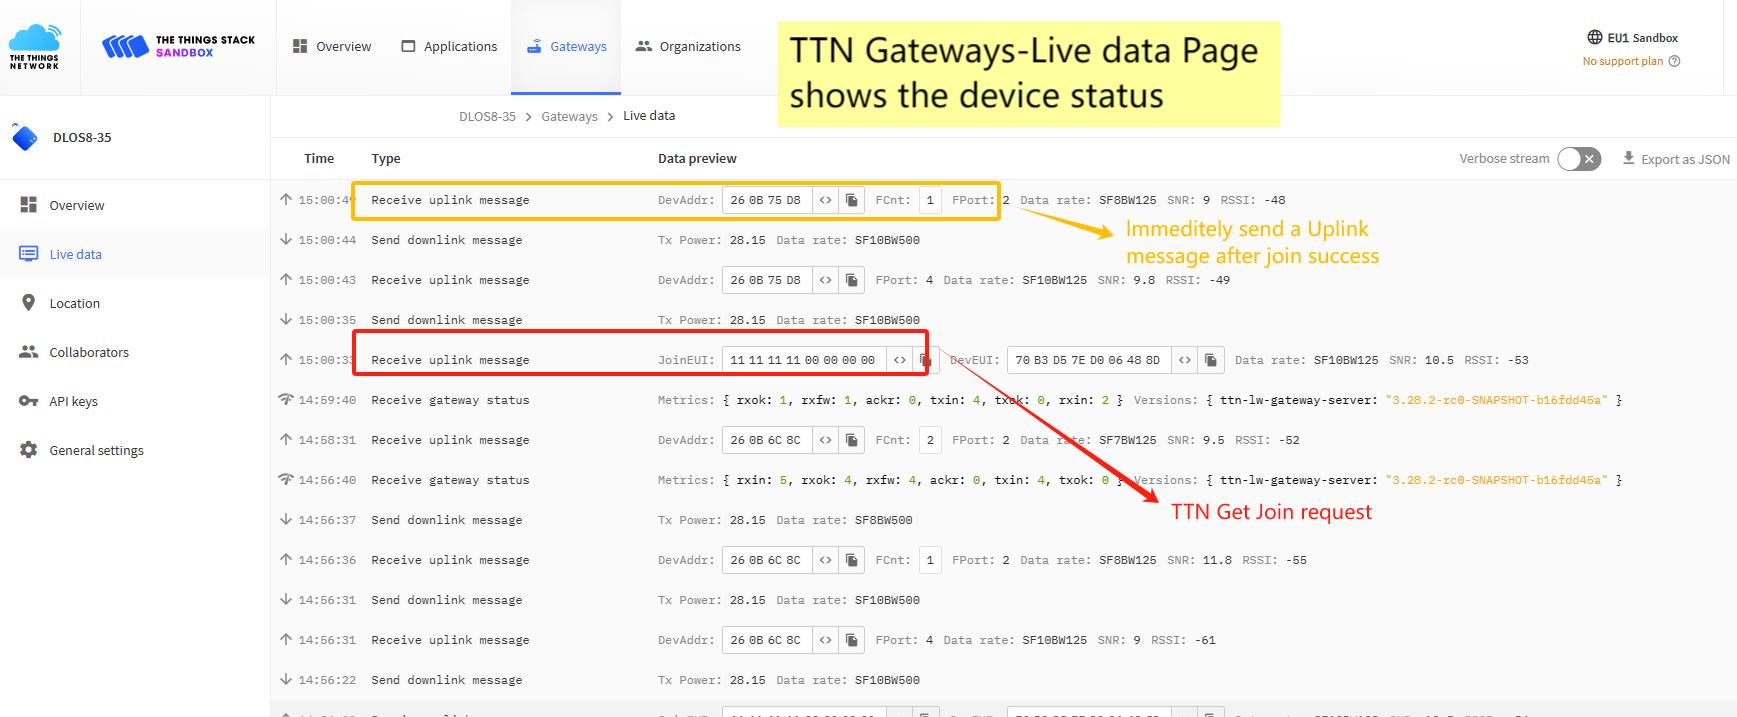
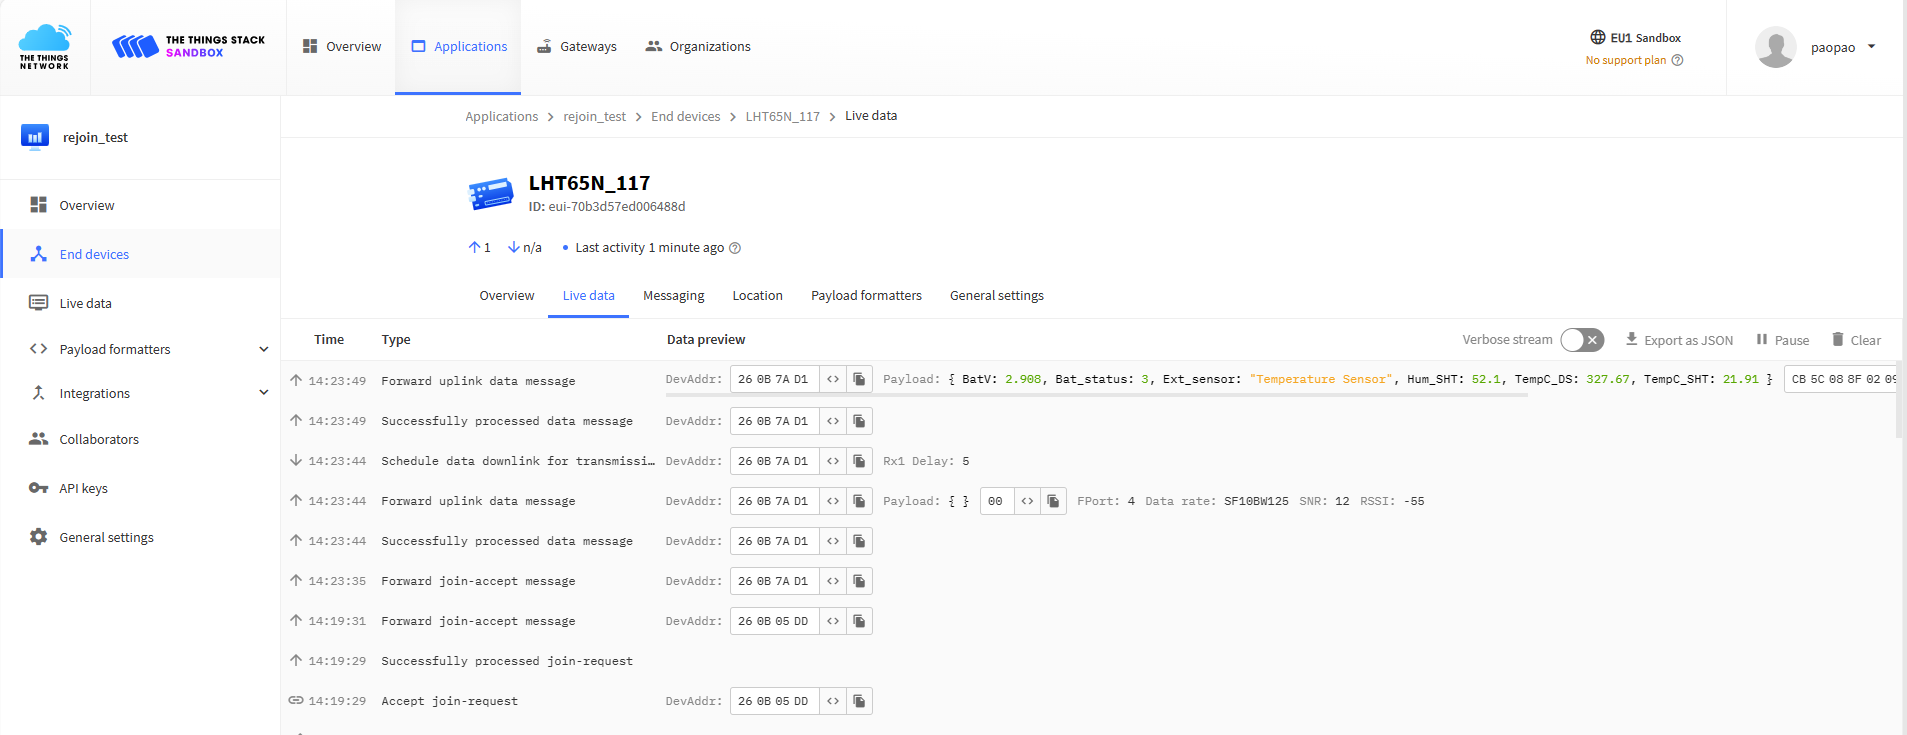
The Traffic for the End node in the server, use TTN as example.
4. Data Page in LoRaWAN server
- If this data page shows the Join Request message from the end node? If not, most properly you have wrong settings in the keys. Keys in the server doesn't match the keys in End Node.
The data for the end device set in server
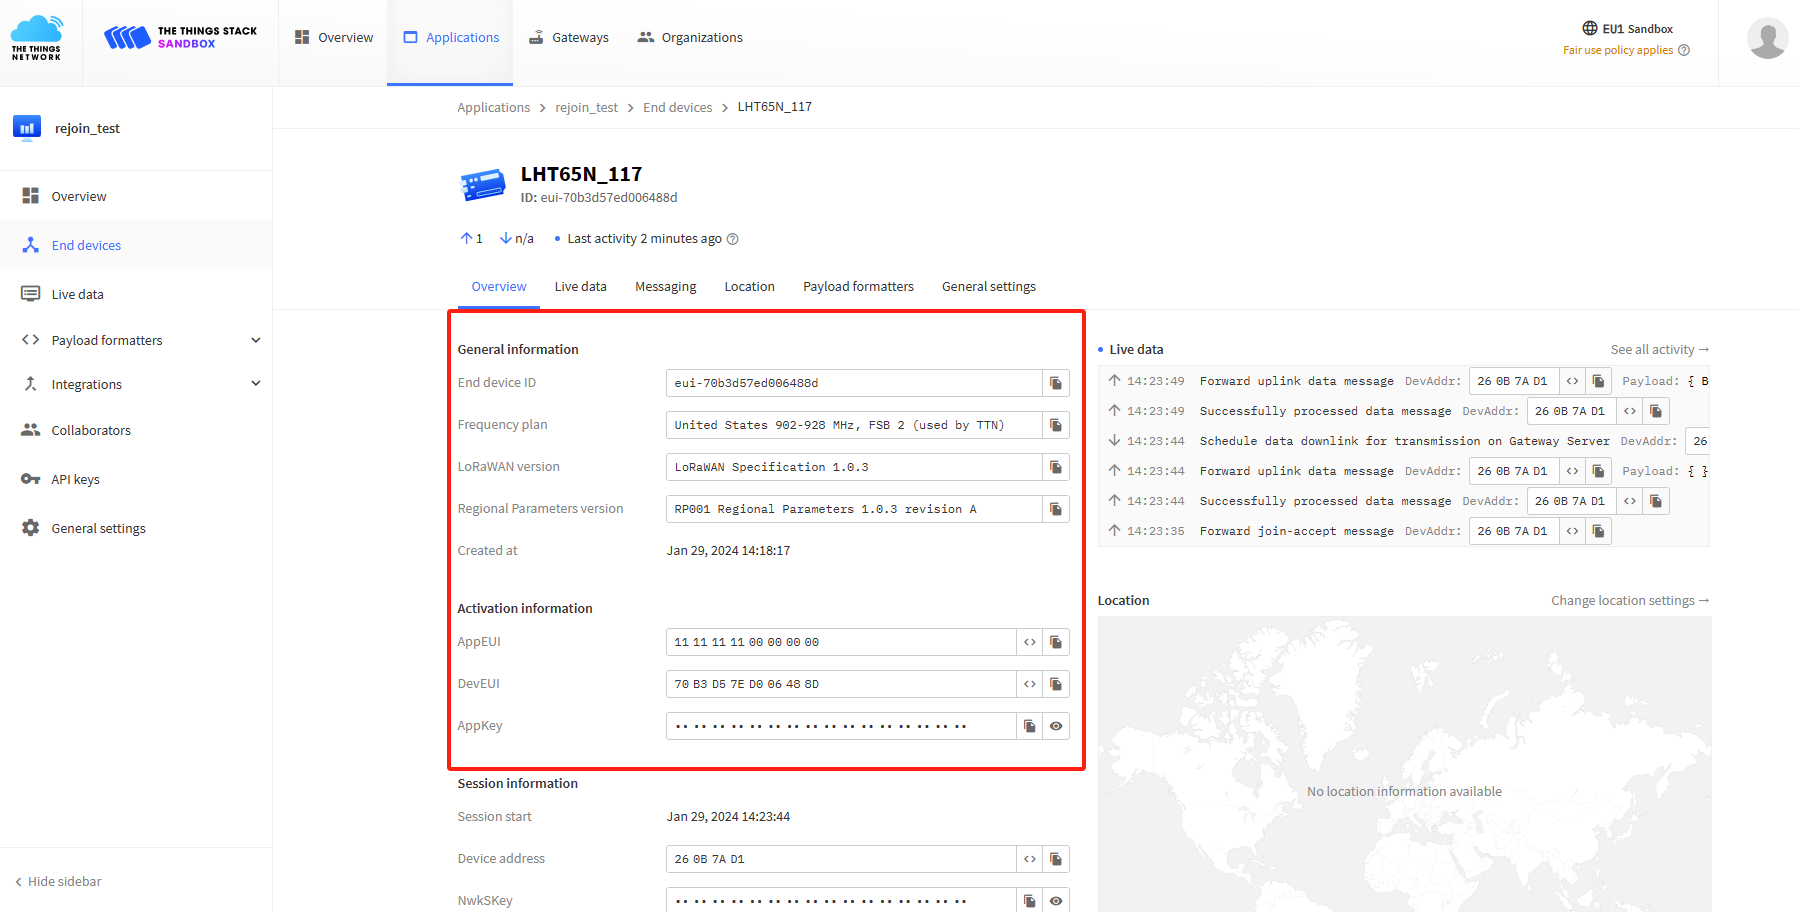
Check if OTAA Keys match the keys in device.
2. Notice of: US915、CN470、AU915
If user has problem to work with LoRaWAN server in band: US915、AU915、CN470
-
What sub-band the server support?
-
What is the sub-band the gateway support?
-
What is the sub-band the end node is using?
All of above should match so End Node can properly Join the server and don't have packet lost.
In LoRaWAN protocol, the frequency bands: US915、AU915、CN470
Here are the frequency tables for these bands as reference:
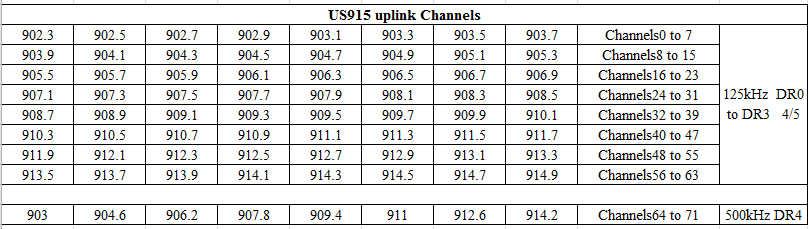
US915 Channels
AU915 Channels
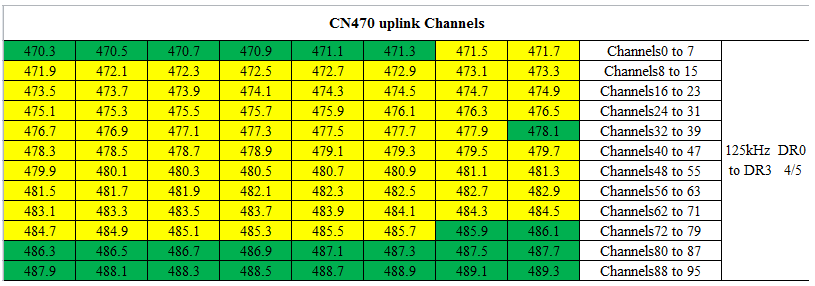
CN470 Channels
If we look at the TTN network server frequency plan, we can see the US915 frequency band use the channel 815.So the End Node must work at the same frequency in US915 815 channels for TTN server.
TTN FREQUENCY PLAN
In dragino end node, user can use AT+CHEcommand to set what frequencies set the end node will use. The default settings for Dragino end node are preconfigure for TTN server, so use 8~15 channels, which is AT+CHE=2. (AT+CHE=1 for first 8 channels, AT+CHE=2 for second 8 channels.. etc, and AT+CHE=0for all 72 channels. )
3. Why I see data lost/ is not periodically uplink? Even the signal strength is good
In this case, we can check if the frequency band matches in End Node, Gateway and LoRaWAN server. A typical case is using US915 in ChirpStack server as below:
-
End node --> Use Sub-band2 (Channel 8,9,10,11,12,13,14,15) for Dragino Sensor. ADR is also enable, this is the default settings for dragino sensors.
-
Gateway --> Use Sub-band2 (Channel 8,9,10,11,12,13,14,15) for Dragino Gateway. this is the default settings for dragino sensors.
-
LoRaWAN server --> ChirpStack default installation and use Sub-band1, enabled_uplink_channels=[0, 1, 2, 3, 4, 5, 6, 7] in the file chirpstack-network-server.toml.
When Sensor power on, it will use sub-band2 to join the network, the frequency matches the settings in gateway so all Join Request will be passed to the server for Join. Server will ask the sensor to change to Sub-band1 in the Join Accept downlink message. Sensor will change to sub-band1 for data upload. This cause the sensor and gateway have different frequencies so user see lost of most data or even no data.
Use Subband2 as a default subband cause the sensor to have problem to work with the LoRaWAN server which use other subband, and use need to access to the end node to change the subband by console. that is not user frendily,. So since Dragino LoRaWAN Stack version DLS-005(release on end of 2020), we have changed the device to use All Subbands for OTAA join, for example, device will use the first frequency in Sub-Band1 as firt OTAA join packet, then use the first frequency in Sub-Band 2 , then first frequency in sub-band 3, and so on. LoRaWAN server will normally provide the required subband in the OTAA accept process, so end node will know what subband it use after join. If LoRaWAN server doesn't provide subband info in OTAA join, end node will use the subband which join success as the working subband. So the new method cause a longer OTAA Join time but will be compatible with all LoRaWAN server. And new method won't affect the normal uplink after Join Success.
4. Why i see packet lost
1. Signal problem 1) ADR automatic adjustment Reason:
When the signal is at a critical value, the server may configure the node to adjust to a lower power DR.
At this time, the server is at risk of losing uplink.
Solution:
Users can manually fix the DR value.
Notice:
-
User need to set Adaptive Data Rate(ADR)=0 first. otherwise device will respond to server's ADR command and change the DR according to server auto-adjustment.
-
Data Rate specifies Spreading Factor. The mapping varies in different frequency bands. User can check this link for detail. rp2-1.0.3-lorawan-regional-parameters.pdf
AT Command: AT+DR Command Example Function Response
AT+DR=?
Get the Data Rate.
5
OK
AT+DR=2
Set the Data Rate.
OK
Downlink Command: 0x2200aaFF
If the downlink payload=220001FF, it means setting the data rate to 1, while type code is 22 00 aa FF.
- Example 1: Downlink Payload: 220001FF // Set
AT+DR=1. - Example 2: Downlink Payload: 220000FF // Set
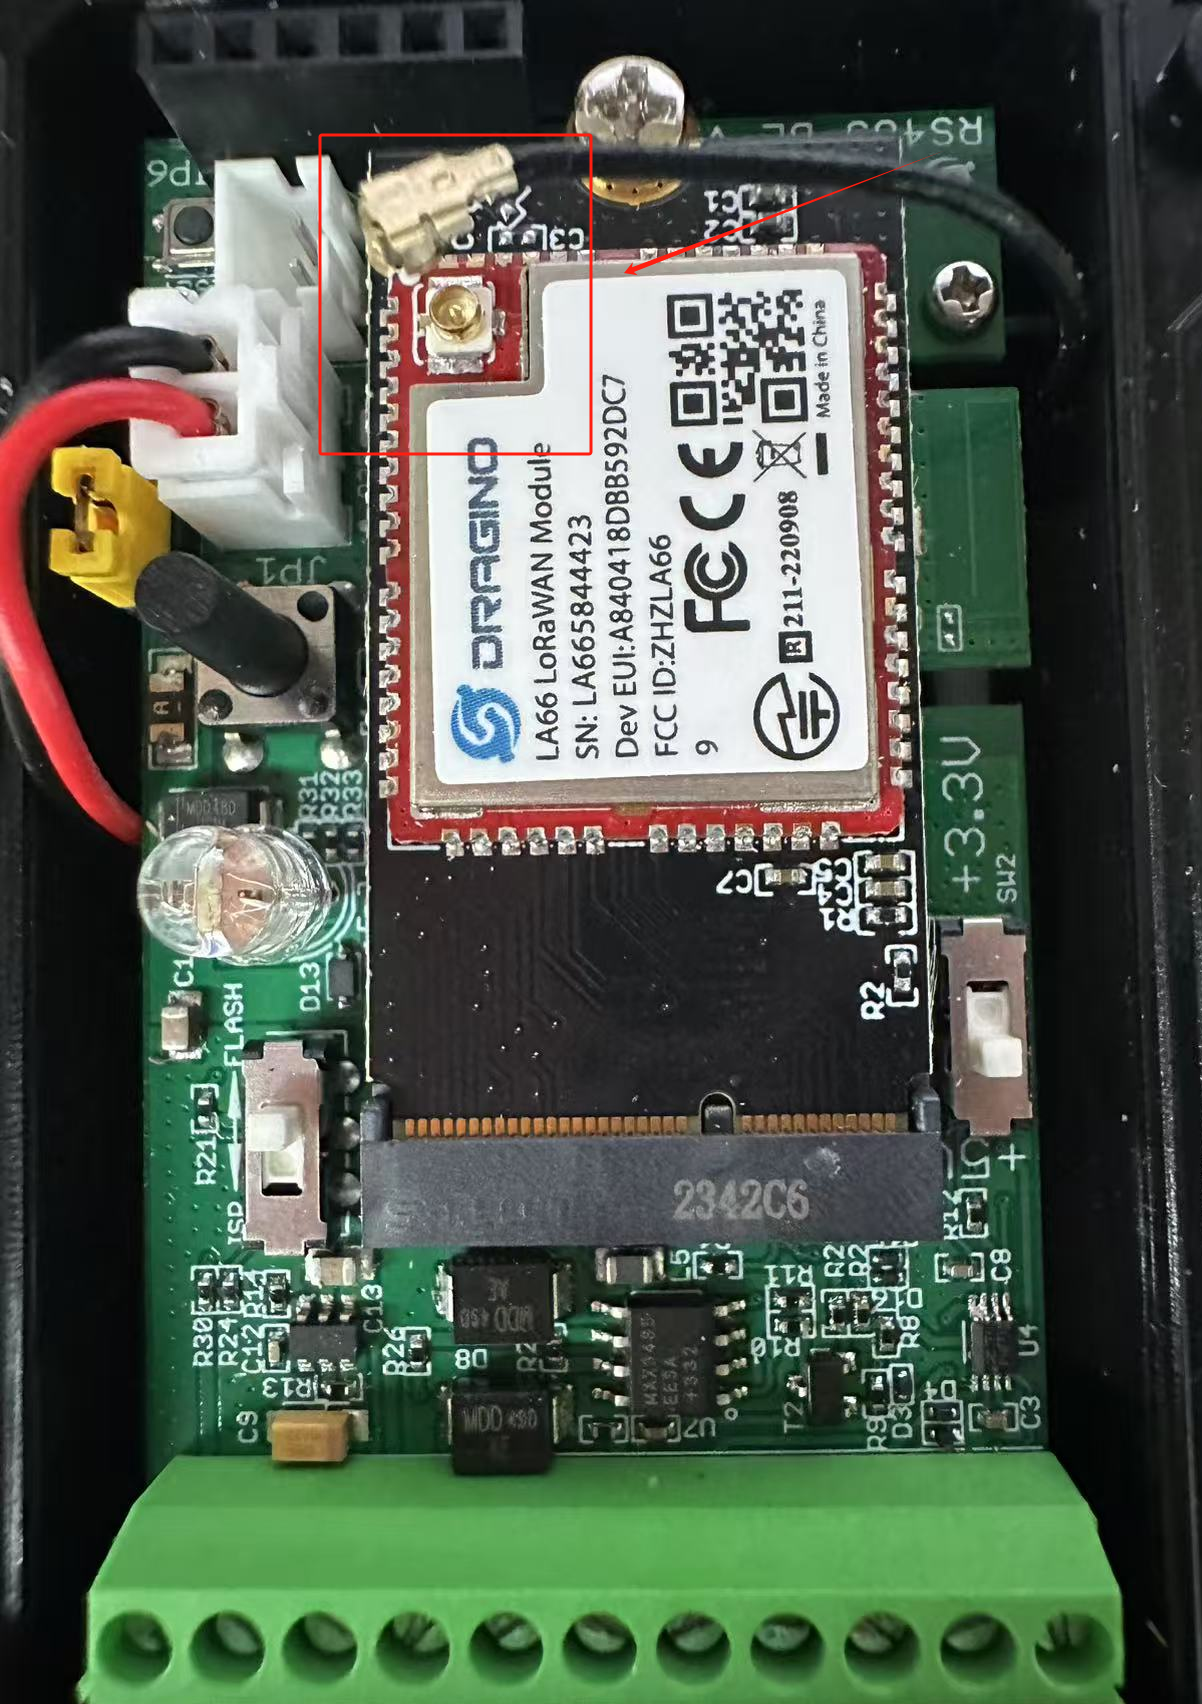
AT+DR=0. 2) Node antenna problem Reason:
Node antenna is loose
Solution:
Please check whether the antenna interface and module interface are detached
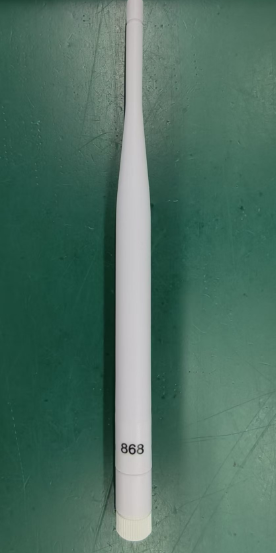
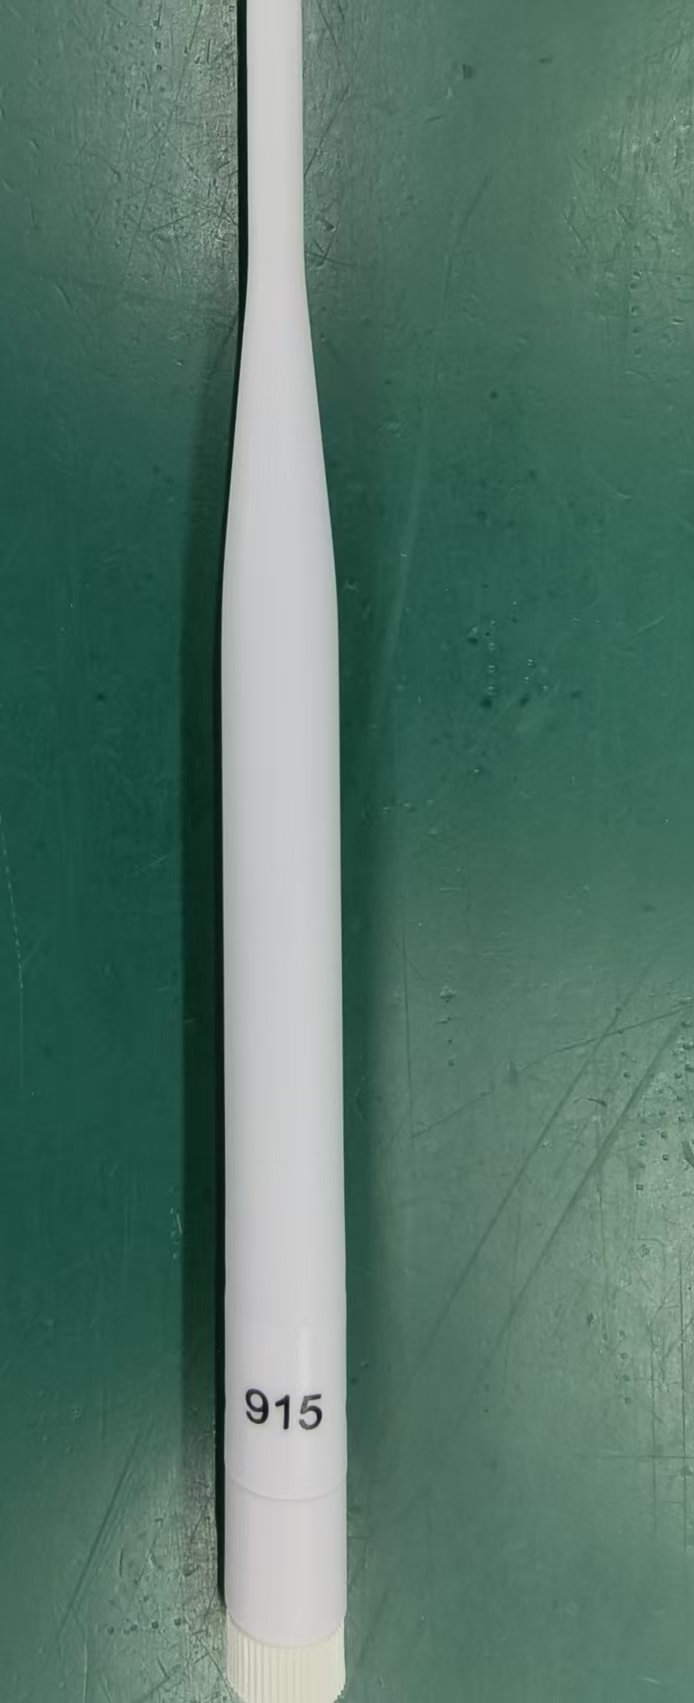
3) Gateway antenna problem Reason:
Gateway uses antenna with wrong frequency band
For example: 868-band gateway uses antenna with 915-band, which will cause the signal to be greatly reduced
Solution:
Please check whether the silk screen on the antenna conflicts with the frequency you set.
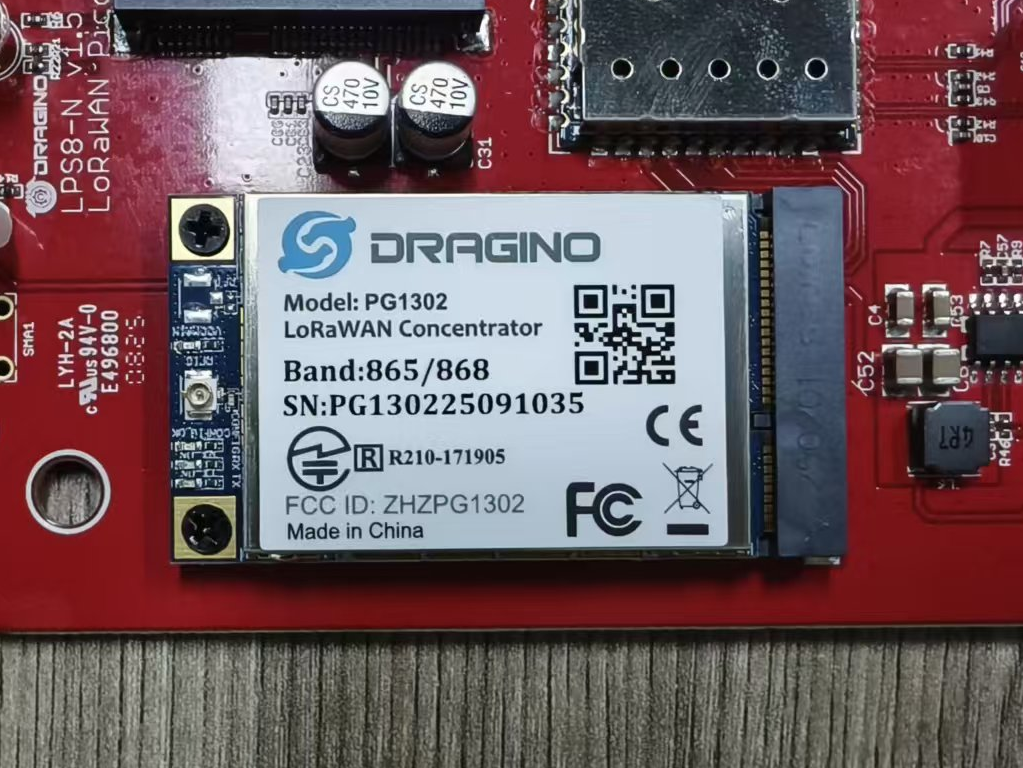
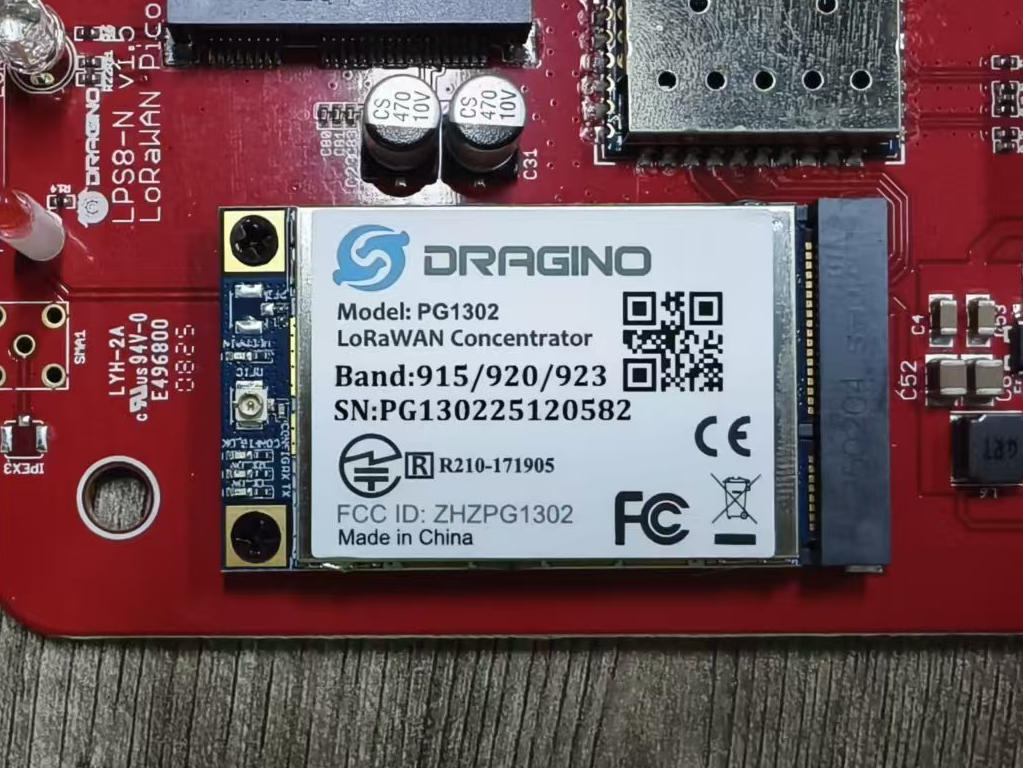
4) Gateway module problem Reason:
Gateway uses module with wrong frequency band
For example: 868-band gateway uses module with 915-band, which will cause the signal to be greatly reduced
Solution:
Please check whether the silkscreen of the module conflicts with the frequency you set.
2. Frequency point problem Reason:
There are multiple frequency configurations in: AS923、US915、AU915、CN470
The frequency point of the gateway or server is wrong or missing.
Solution:
Users need to check whether the server or gateway configuration is missing or has an incorrect frequency.
The frequency range used in the dragino node is as follows
3. Frequency band problem Reason:
When there are multiple gateways, the node cannot lock the frequency band.
Solution:
By default, the frequency bands: US915、AU915、CN470
You can configure the end node to work in 8 channel mode by using the AT+CHEcommand. The 500kHz channels are always included for OTAA.
For example, in US915 band, the frequency table is as below. By default, the end node will use all channels (071) for OTAA Join process. After the OTAA Join, the end node will use these all channels (071) to send uplink packets.
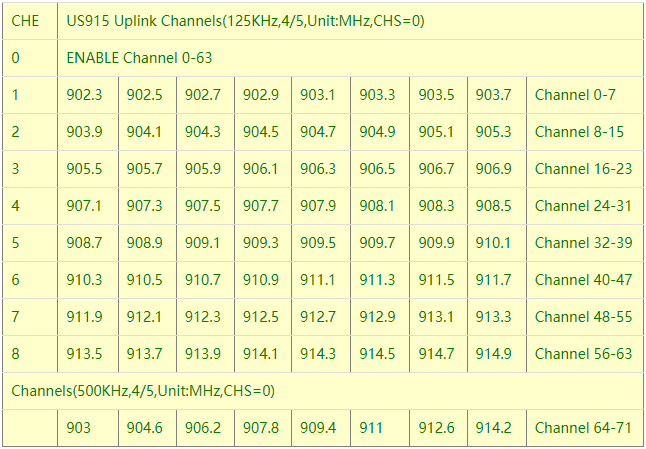
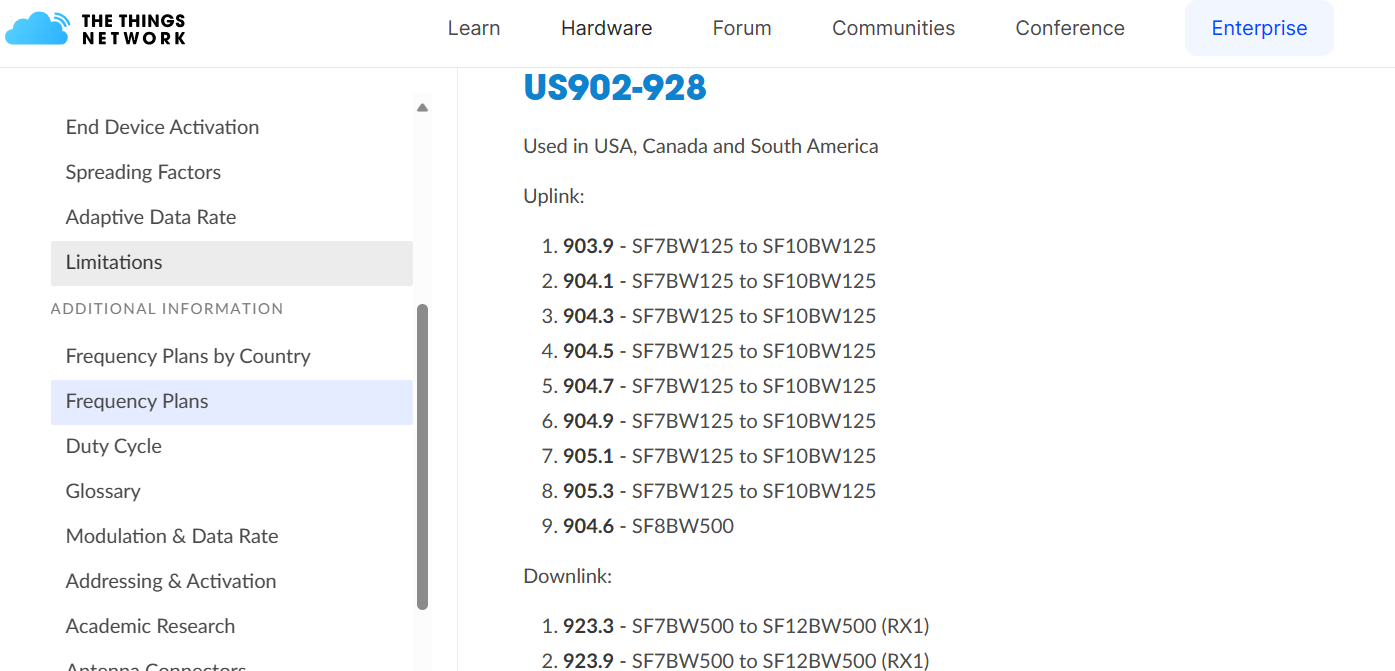
When you use the TTN V3 network, the US915 frequency bands use are:
-
903.9 - SF7BW125 to SF10BW125
-
904.1 - SF7BW125 to SF10BW125
-
904.3 - SF7BW125 to SF10BW125
-
904.5 - SF7BW125 to SF10BW125
-
904.7 - SF7BW125 to SF10BW125
-
904.9 - SF7BW125 to SF10BW125
-
905.1 - SF7BW125 to SF10BW125
-
905.3 - SF7BW125 to SF10BW125
-
904.6 - SF8BW500
Because the end node is now hopping in 72 frequency, it makes it difficult for the devices to Join the TTN V3 network and uplink data. To solve this issue, you can access the device via the AT commands and run:
AT+CHE=2
ATZ
to set the end node to work in 8 channel mode. The device will work in Channel 8-15 & 64-71 for OTAA, and channel 8-15 for Uplink.
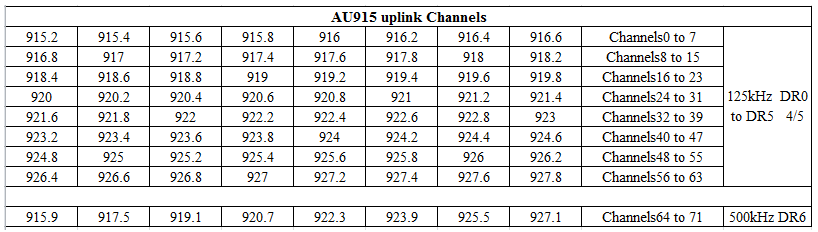
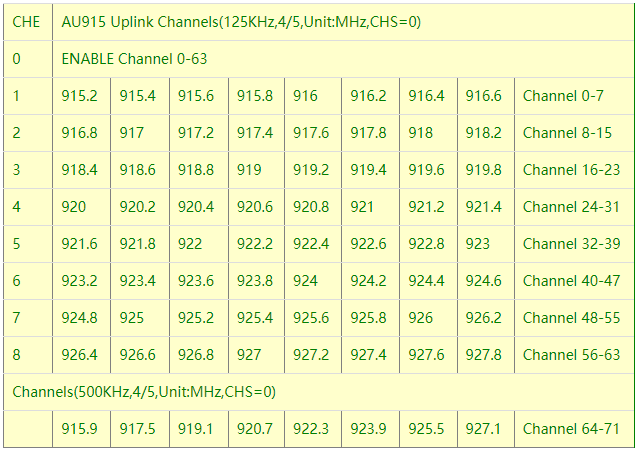
The AU915 band is similar. Below are the AU915 Uplink Channels.
5. Transmision on ABP Mode
In ABP mode, there is a Frame Counter Checks. With this check enabled, the server will only accept the frame with a higher counter. If you reboot the device in ABP mode, the device will start from count 0, so you won't be able to see the frame update in server.
So in ABP mode, first check if the packet already arrive your gateway, if the packet arrive gatewat but didn't arrive server. Please check if this is the issue.
To solve this, disable the Frame Counter Check will solve this issue , or reset the frame counter in the device page.
Disable Frame Counter Check in ABP Mode
6. Downstream Debug
6.1 How it work
LoRaWAN End node will open two receive windows to receive the downstream data. If the downstream packets arrive the end node at these receive windows, the end node will be able to get this packet and process it.
Depends on Class A or Class C, the receive windows will be a little difference. The main difference between Class A and Class C:
- Class A : Suitable for Battery powered end node. Class A will save a lot of power but it can only receive downlink after each uplink
- Class C: End node can receive downlink immediately but have higher power consumption.
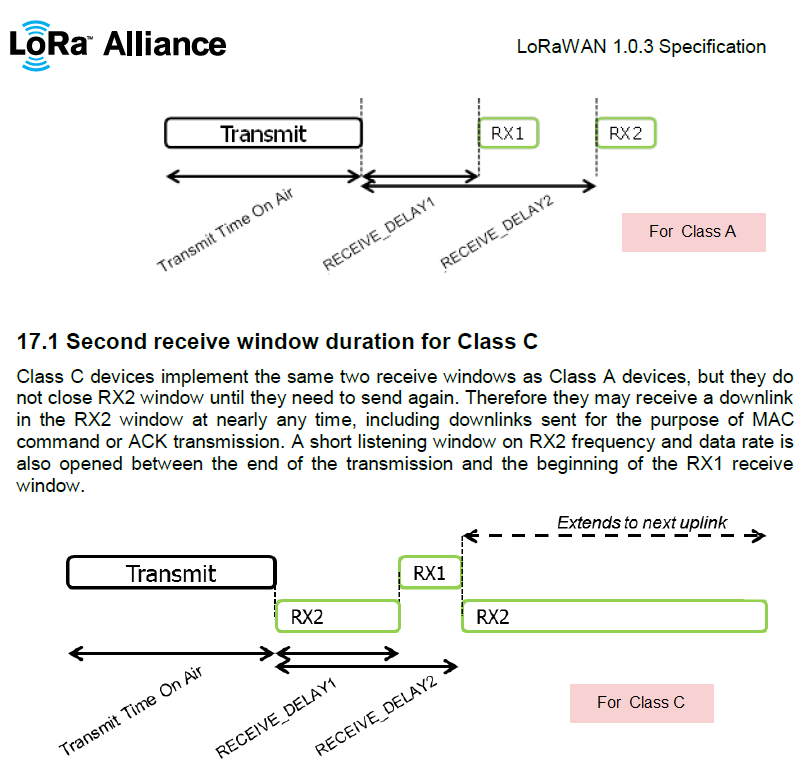
receive windows for Class A and Class C
Below are the requirement for the End Device to receive the packets.
-
The End Device must open the receive windows: RX1 or RX2
-
The LoRaWAN server must send a downstream packet, and the gateway forward this downstream packet for this end node.
-
This downstream packet must arrive to the end node while RX1 or RX2 is open.
-
This packet must match the frequency of the RX1 or RX2 window.
-
This packet must match the DataRate of RX1(RX1DR) or RX2 (RX2DR). This is the common fail point, because different lorawan server might use different RX2DR and they don't info End Node via ADR message so cause the mismatch. If this happen, user need to change the RX2DR to the right value in end node. In OTAA, LoRaWAN Server will send the RX2DR setting in Join Accept message so the end node will auto adjust. but ABP uplink doesn't support this auto change.
6.2 See Debug Info
For LoRaWAN Server
We can check if there is downlink message for this end node, use TTN for example:
Configure a downlink to the end device
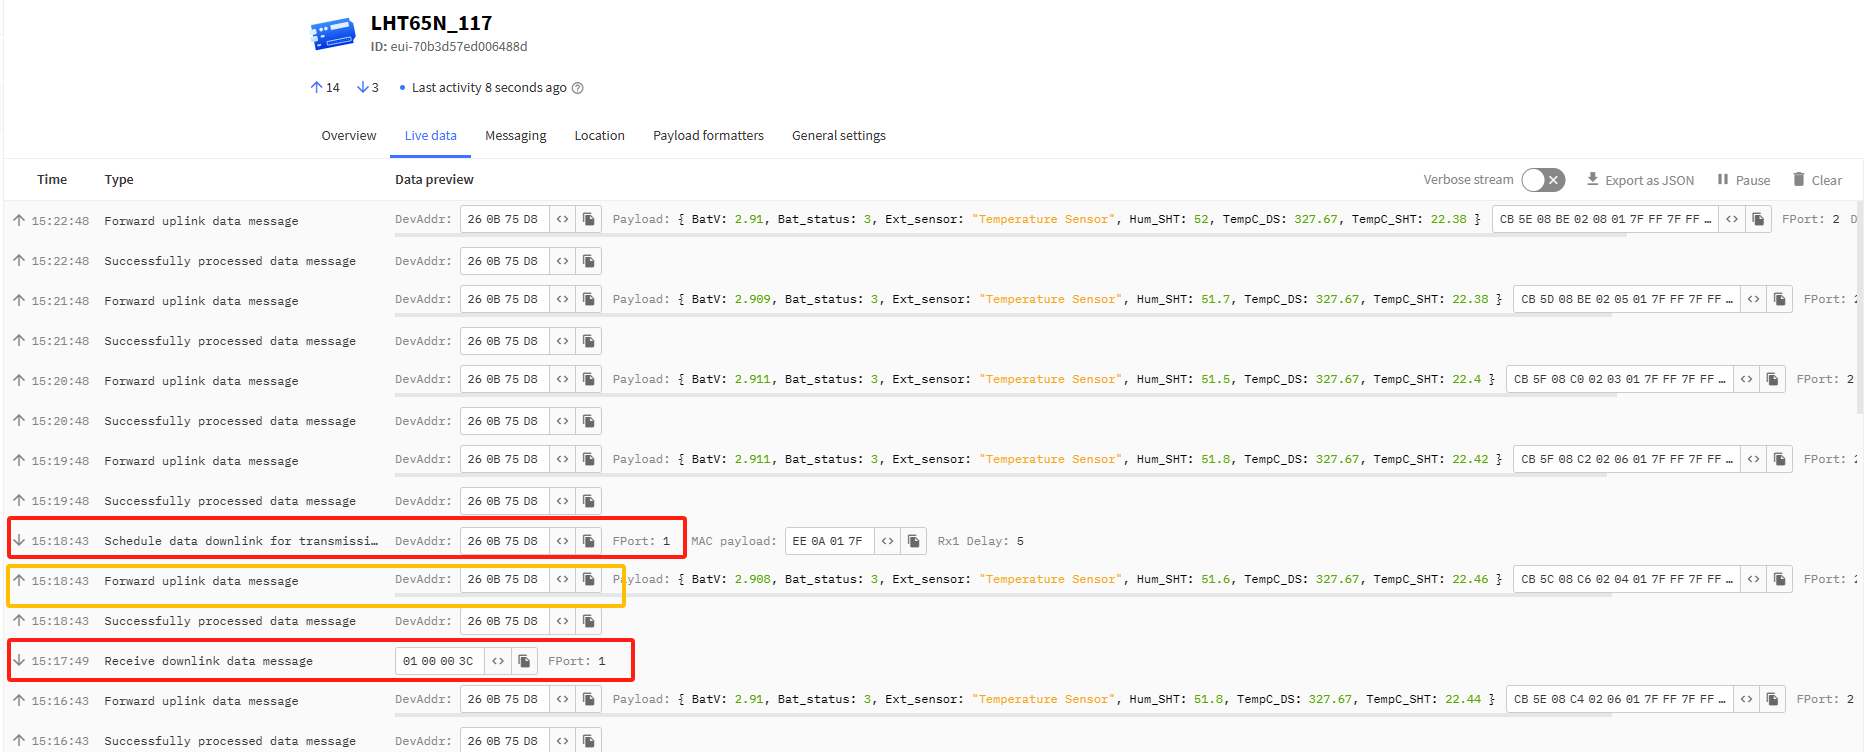
Set a downstream in TTN and see it is sent
Note: After the downlink command is successfully sent from the platform to the node, the downlink command is executed only after the platform receives the next uplink package from the node.
This downlink info will then pass to the gateway downlink list. and the DR which is used (SF7BW500) in US915 is DR5.
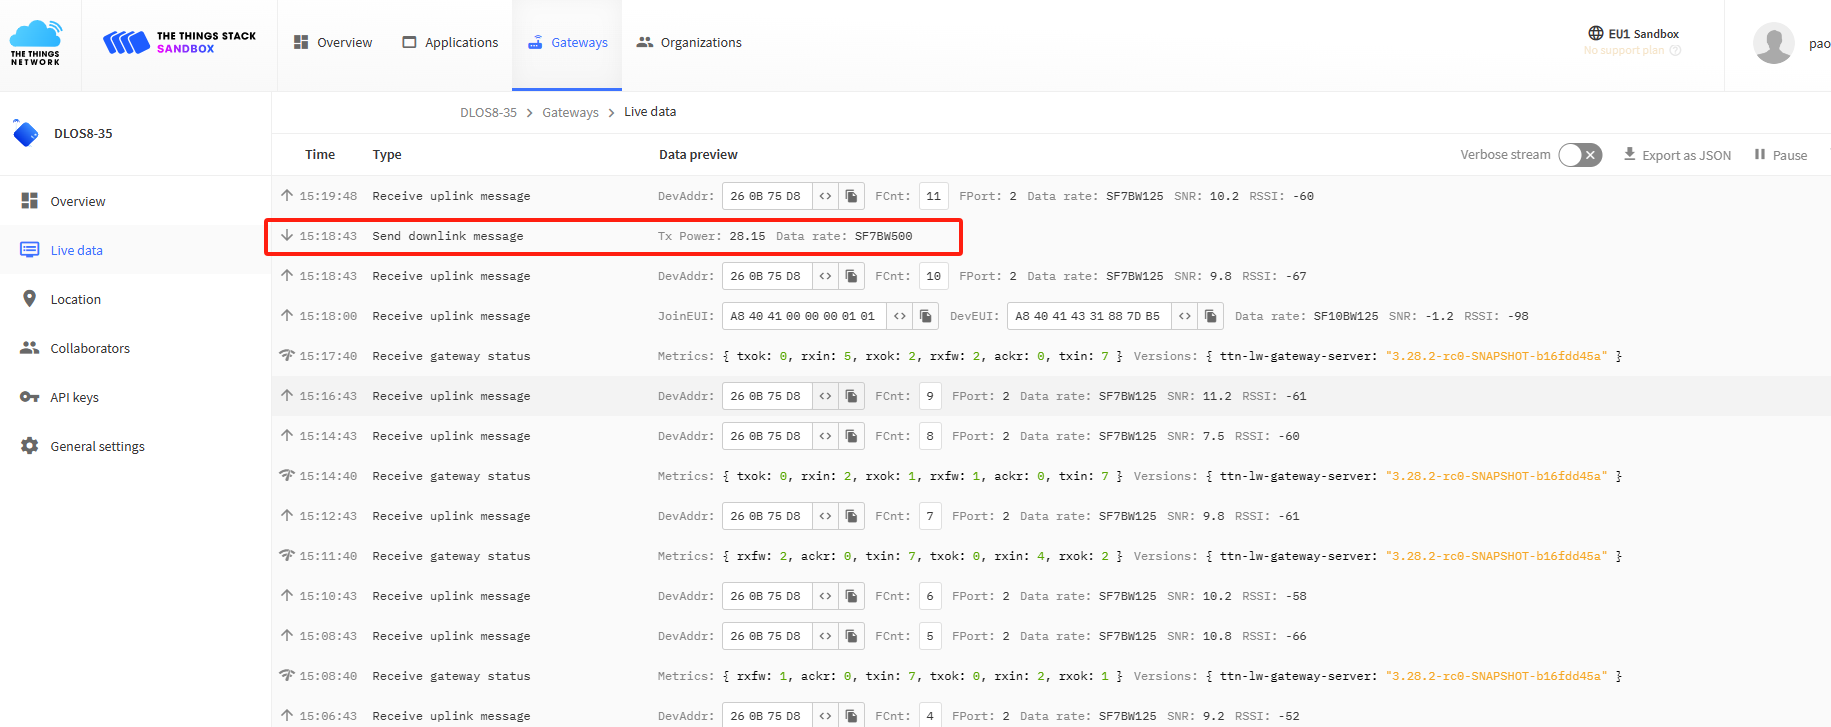
Gateway Traffic can see this downlink info
For LoRaWAN Gateway
When the downlink packet appear on the traffic of Gateway page. The LoRaWAN gateway can get it from LoRaWAN server and transmit it. In Dragino Gateway, this can be checked by running "logread -f" in the SSH console. and see below:
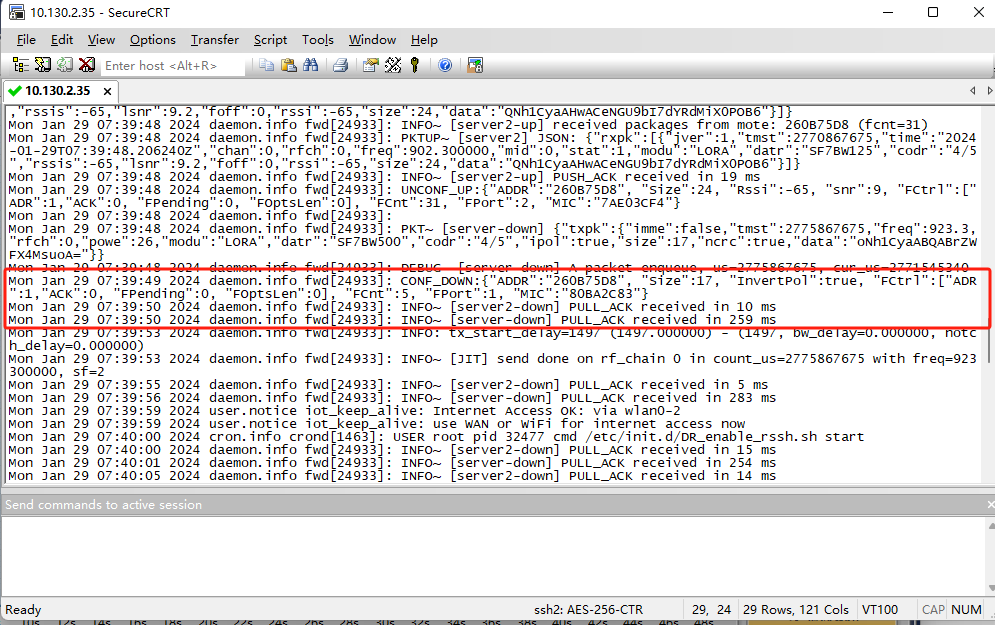
Gateway Sent out this packet
For End Node
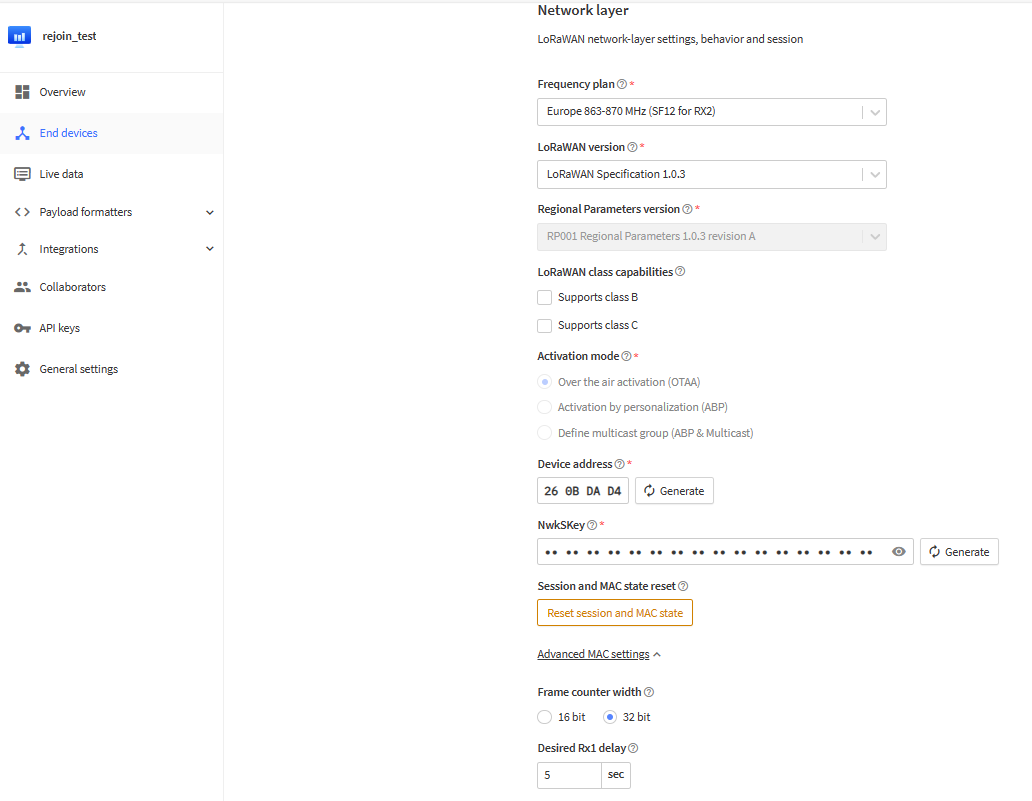
we can use AT Command (AT+CFG) to check the RX1 configure and RX2 configure. as below:
-
AT+RX2FQ=869525000---> The RX2 Window frequency -
AT+RX2DR=3---> The RX2 DataRate -
AT+RX1DL=1000---> Receive Delay 1 -
AT+RX2DL=2000---> Receive Delay 2
when the device running, we can see below info:
[12502]***** UpLinkCounter= 0 ***** [12503]TX on freq 868500000 Hz at DR 0 [13992]txDone [15022]RX on freq 868500000 Hz at DR 0 --> RX1 window open at frequency: 868500000, DR0, after 15022-13992= 1030ms of txdone [15222]rxTimeOut --> no packet arrive in RX1 window. (duration: 200ms) [15987]RX on freq 869525000 Hz at DR 3 --> RX2 window open at frequency: 869525000, DR3, after 15987-13992= 1995ms of txdone [16027]rxTimeOut --> no packet arrive in RX2 window. (duration: 40 ms)
Another message:
[12502]***** UpLinkCounter= 0 ***** [12503]TX on freq 868100000 Hz at DR 0 [13992]txDone [15022]RX on freq 868100000 Hz at DR 0 [15222]rxTimeOut [15987]RX on freq 869525000 Hz at DR 3 [16185]rxDone --> We have got the downstream packet. Rssi= -64 Receive data 1:0012345678
6.3 If problem doesn't solve
If user has checked below steps and still can't solve the problem, please send us (support@dragino.com) the sceenshots for each step to check. They include:
-
End node console to show the transmit freuqency and DR.
-
Gateway (from gateway UI) traffic to show the packet got from end node and receive from Server.
-
Gateway traffic (from server UI) to shows the data exchange between gateway and server.
-
End Node traffic (from server UI) to shows end node activity in server.
7. Downlink Issue -- Packet REJECTED, unsupported frequency
In LoRaWAN, the gateway will use the frequency specify by the server to transmit a packet as downlink purpose. Each Frequency band has different downlink frequency. and the gateway has a frequency range limited to transmit downlink.
So if the LoRaWAN server is an AS923 server which ask the gateway to transmit at 923.2Mhz frequency, but the gateway is IN868 frequency band (support 865~867Mhz to transmit). In the gateway log it will show something like below:
Sat Nov 21 08:04:17 2020 daemon.info lora_pkt_fwd[1680]: ERROR~ Packet REJECTED, unsupported frequency - 923200000 (min:865000000,max:867000000)
In this case, please double check the gateway frequency and the server frequency band.
8. Decrypt a LoRaWAN Packet
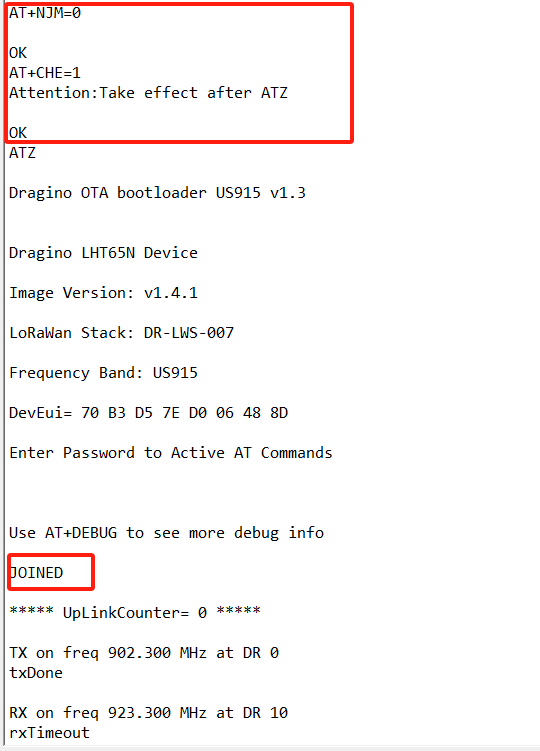
1. LHT65N End device configure: Change to ABP Mode: AT+NJM=0 Change to fix frequency: AT+CHE=1
AT+CFG(Print configuration):
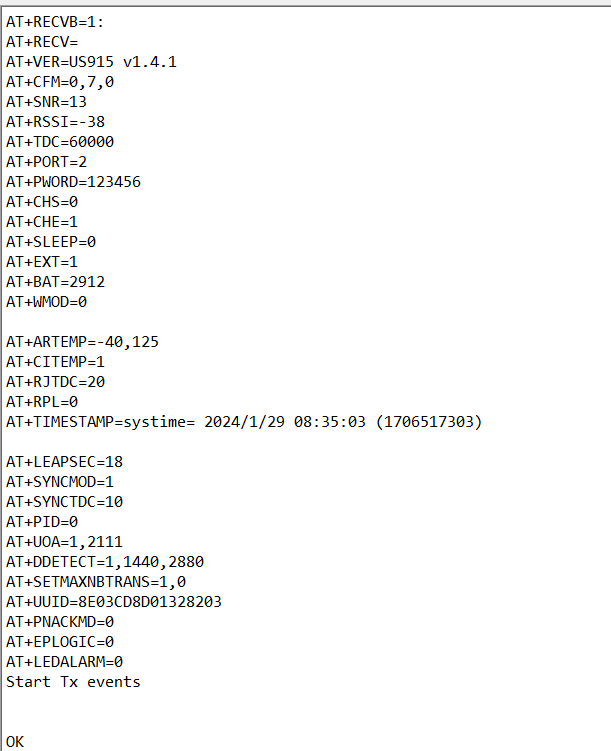
Configuration:
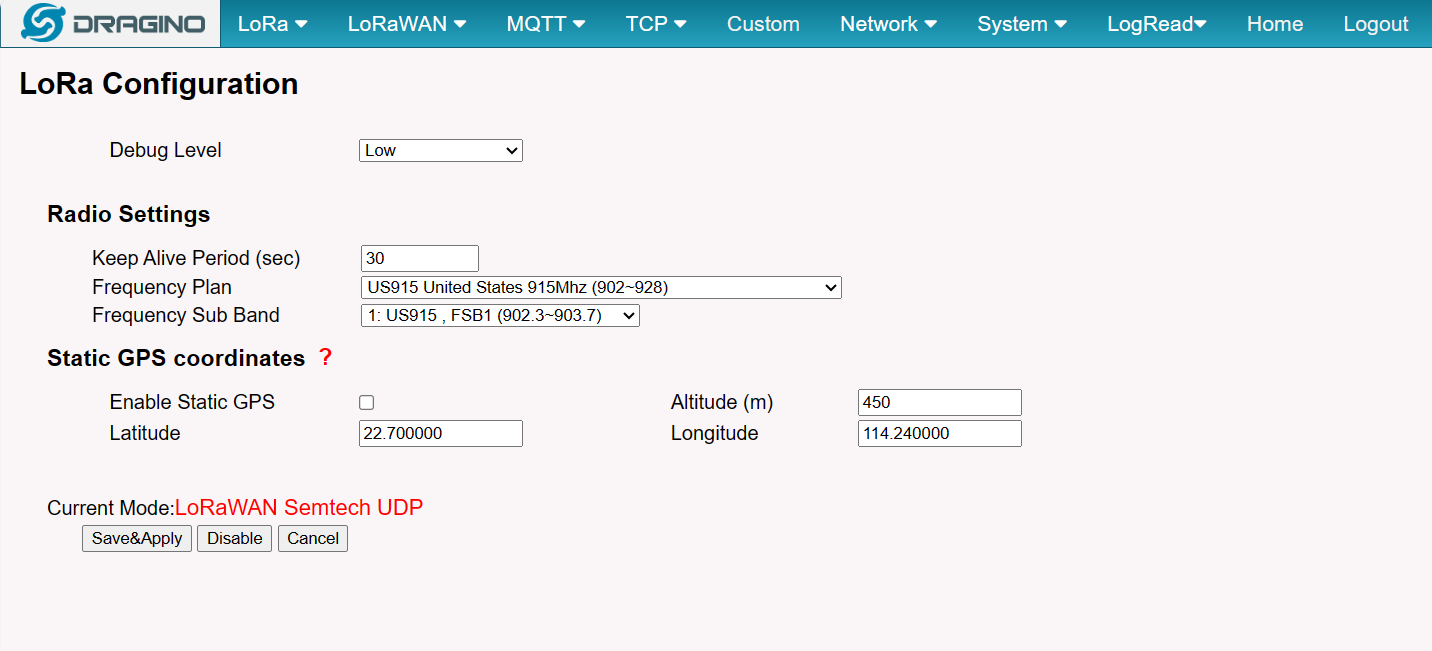
2. In LPS8-v2, configure to receive above message
In LPS8-v2 console, we can see the Base64 receive are:
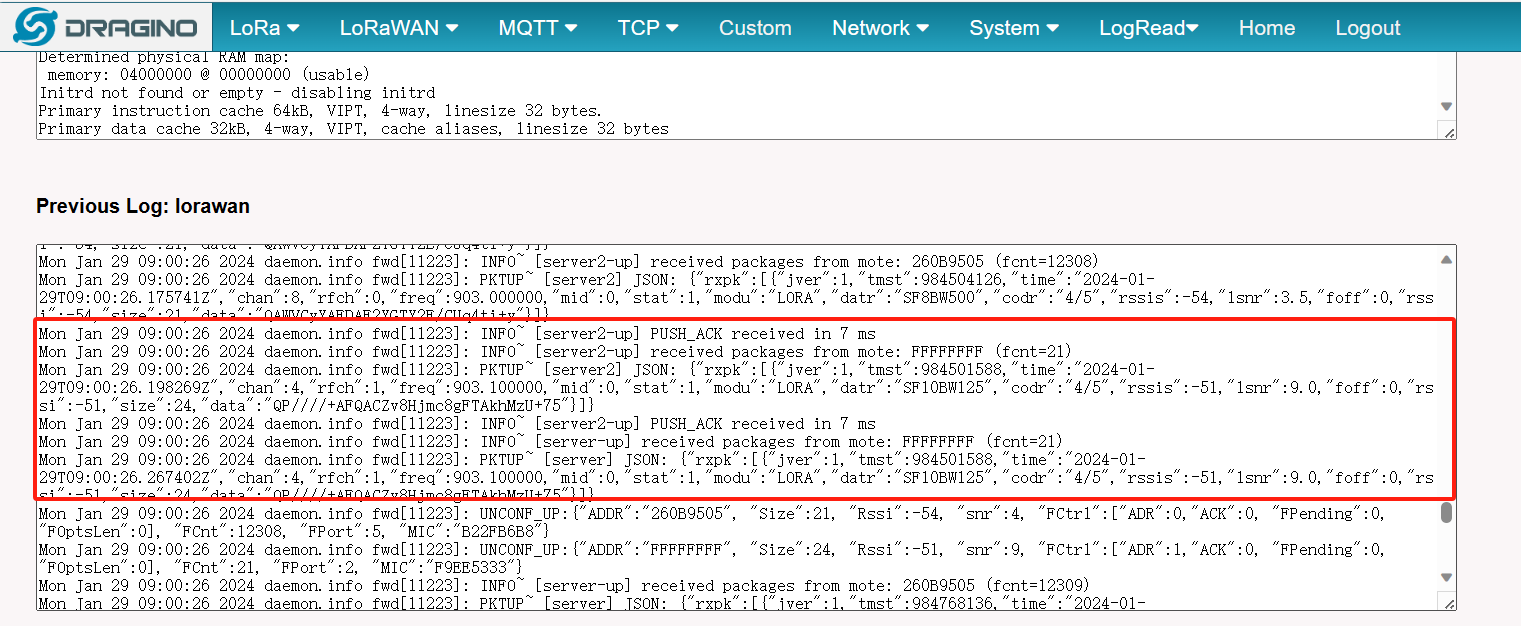
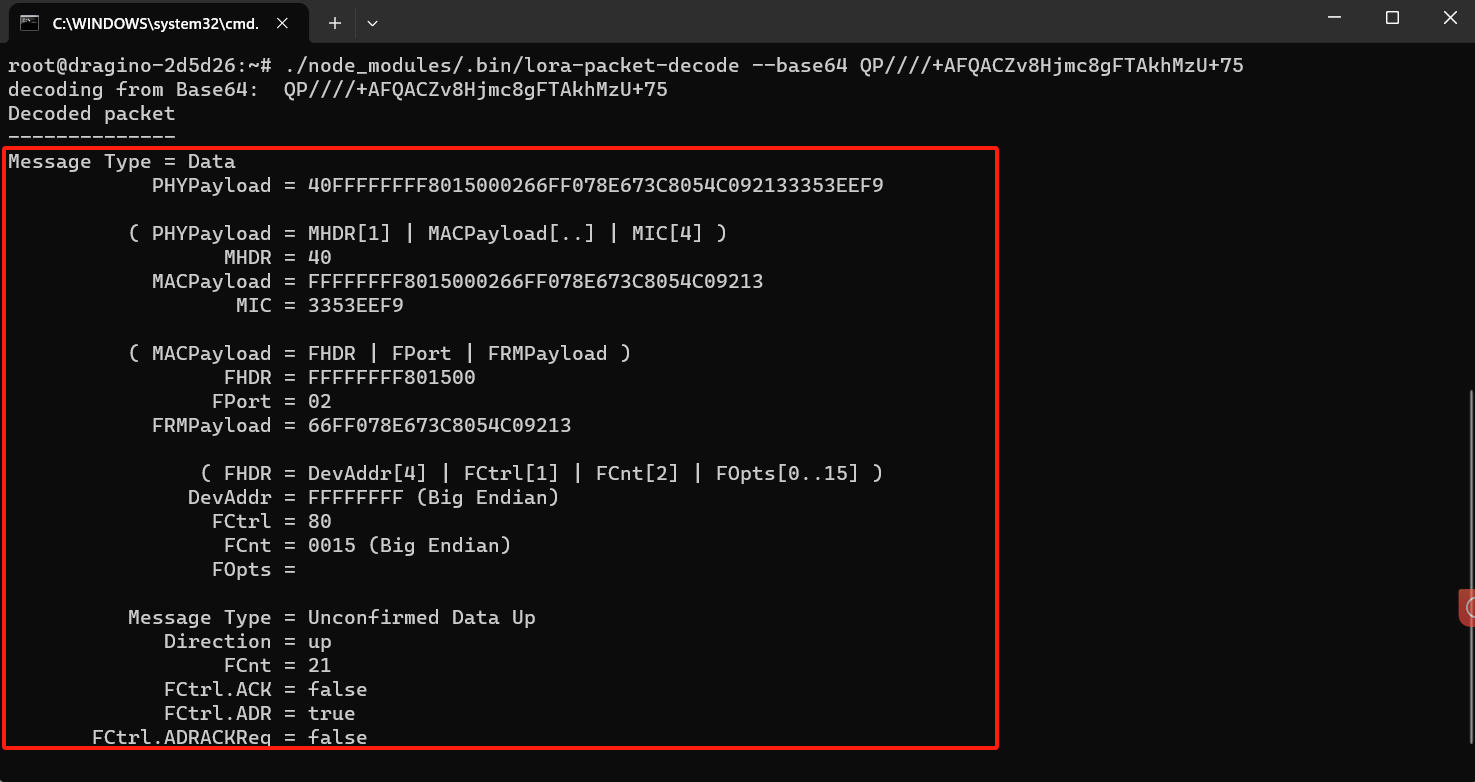
3. Decode the info in CMD(Command prompt window)
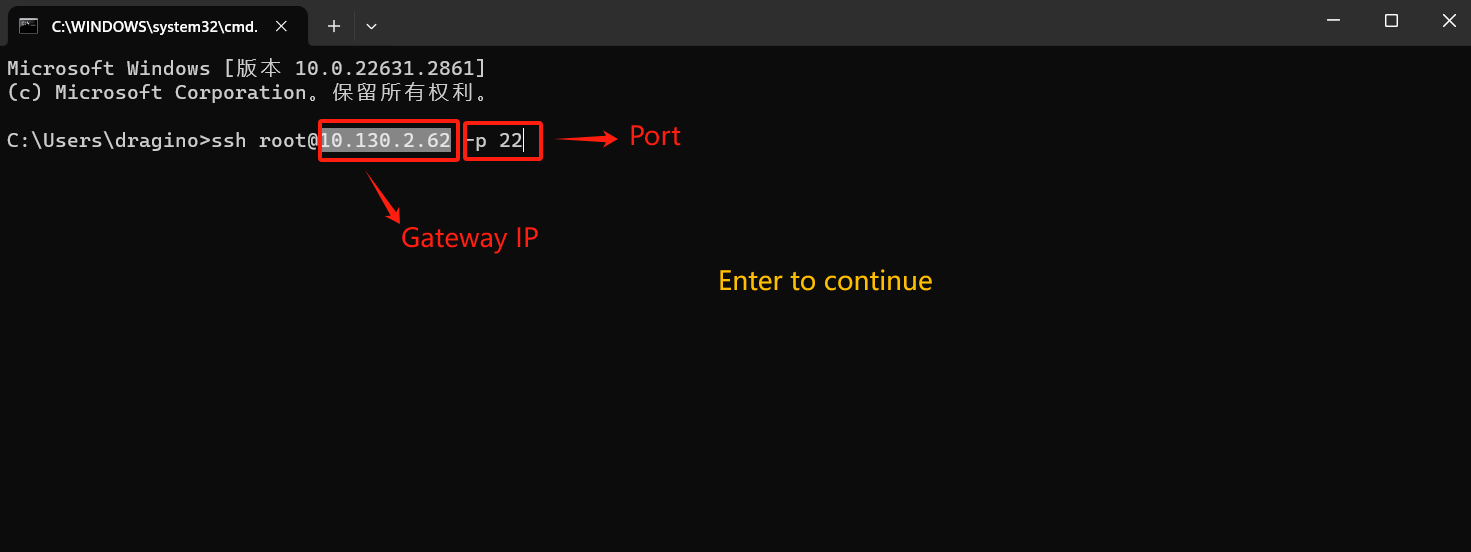
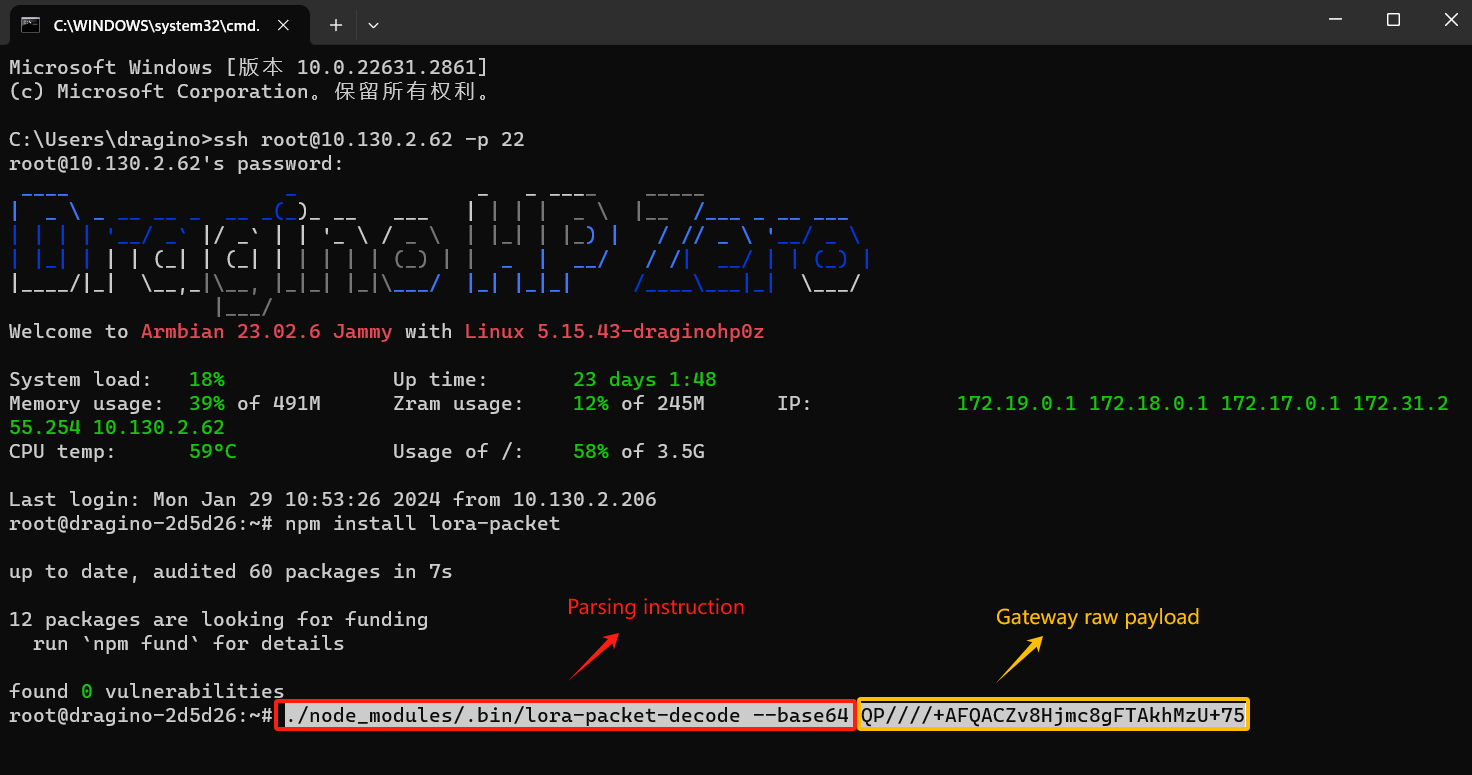
LoRa packet Base64 format: QP////+AFQACZv8Hjmc8gFTAkhMzU+75 (from LPS8-v2)
Then the instructions and format parsed in SecureCRT are: ./node_modules/.bin/lora-packet-decode --base64 QP////+AFQACZv8Hjmc8gFTAkhMzU+75
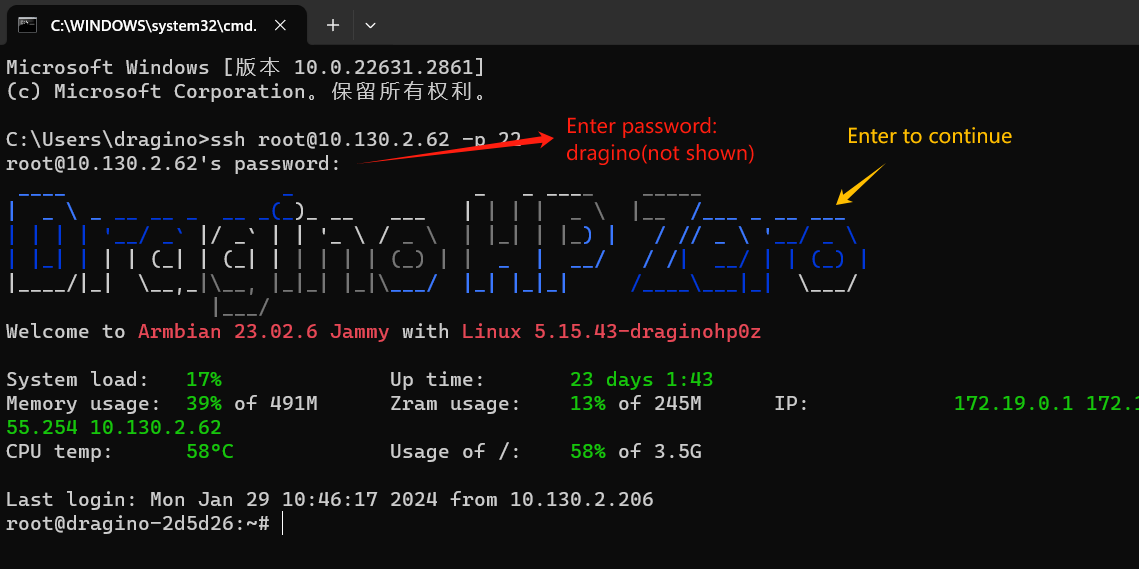
Step1: Open CMD, Enter the gateway IP and port.(ssh root@gateway IP -p 22)
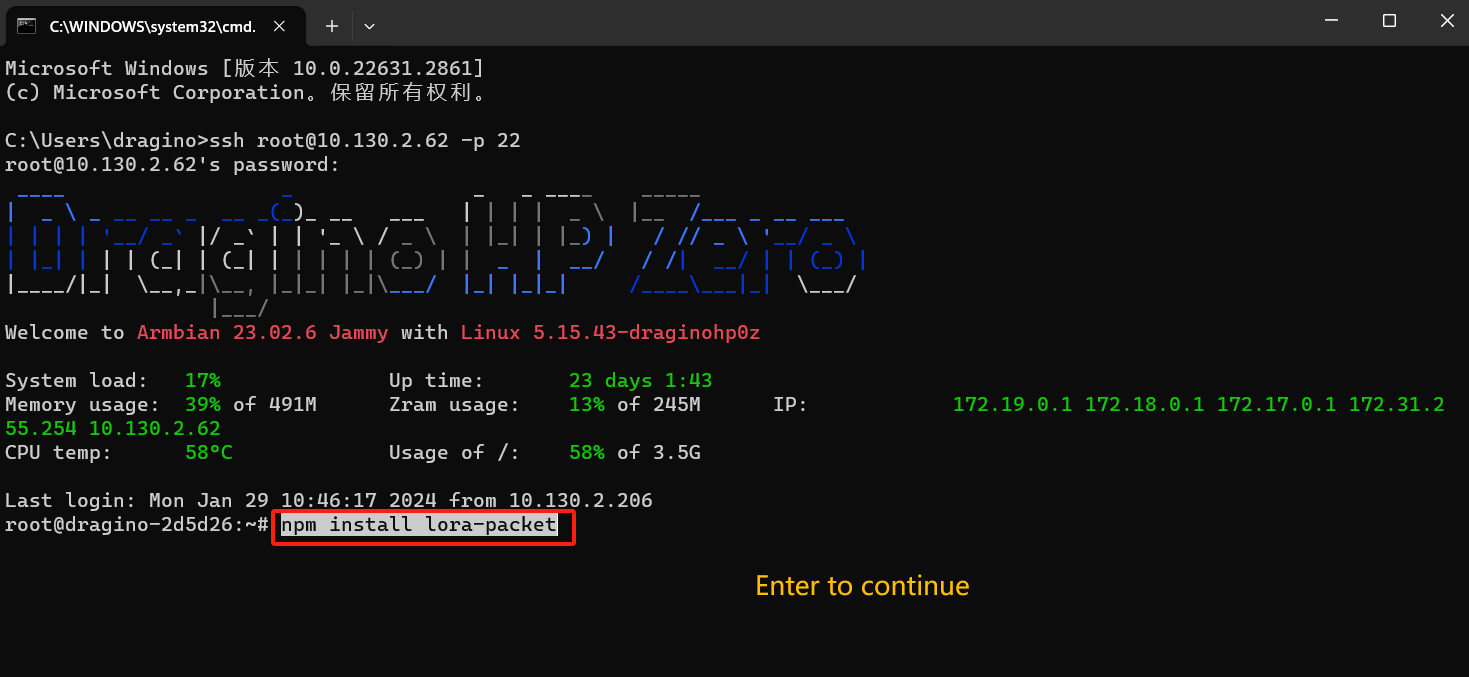
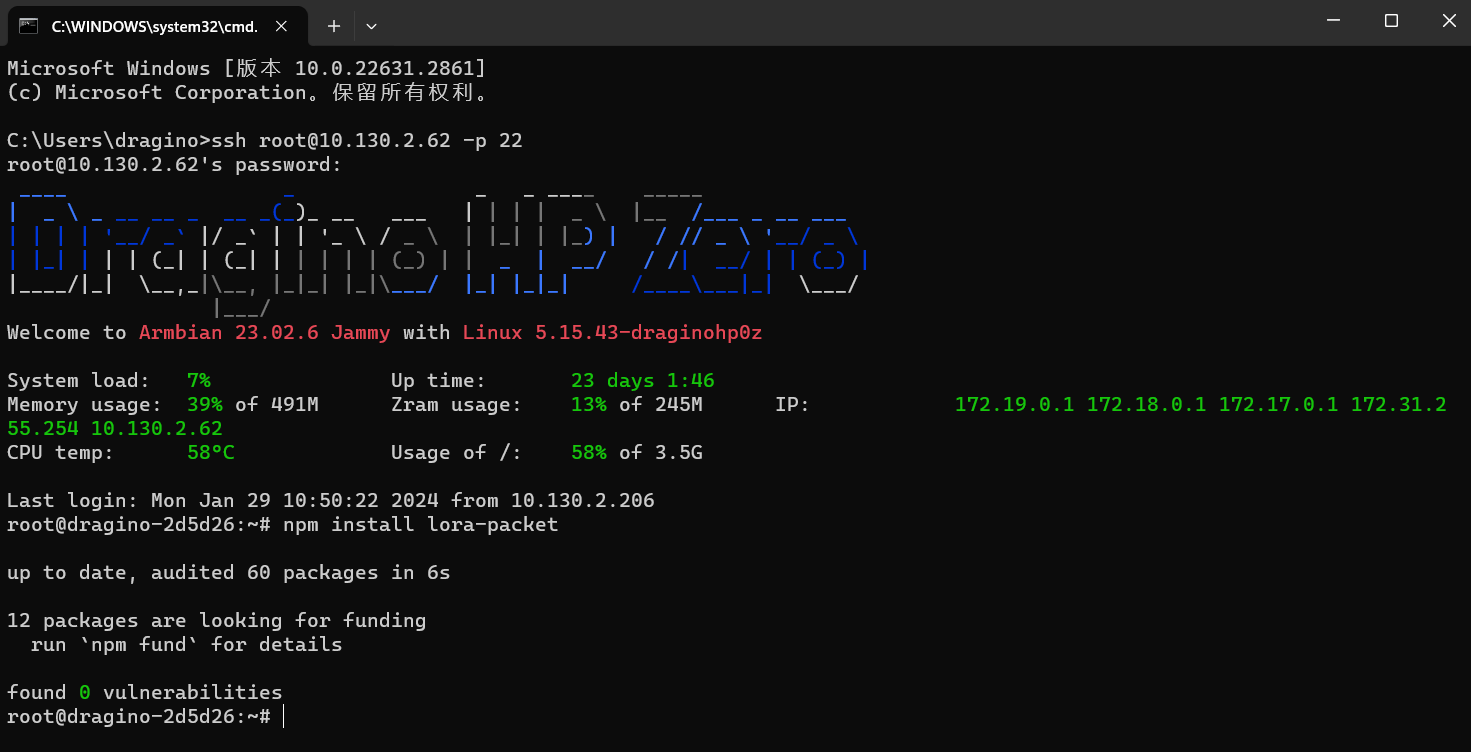
Step2: Enter the command to download the LoRa parsing package.(npm install lora-packet)
Step3: Parse the gateway raw payload.(./node_modules/.bin/lora-packet-decode --base64 QP////+AFQACZv8Hjmc8gFTAkhMzU+75)
9. Why I see uplink 0x00 periodically on the LHT65 v1.8 firmware
Since firmware v1.8, LHT65 will send MAC command to request time, in the case if DR only support max 11 bytes, this MAC command will be bundled to a separate uplink payload with 0x00.
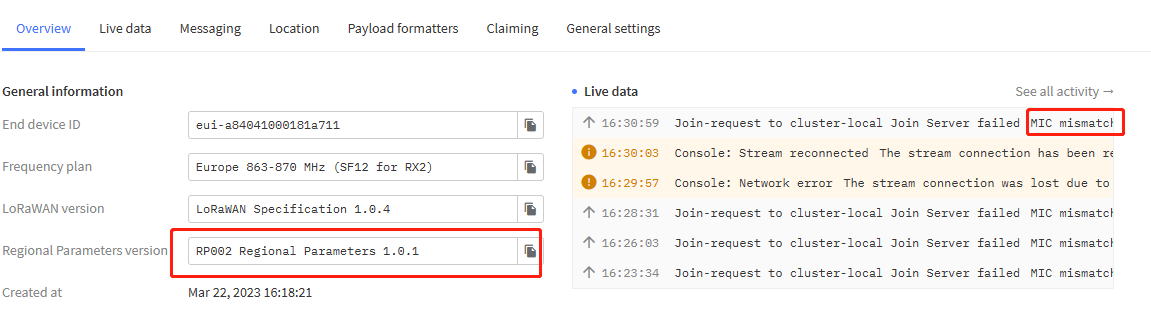
10. Why do I see a "MIC Mismatch" error message from the server?
- If the user receives a "MIC Mismatch" message after registering the node on the server.
It is likely that the user filled in the wrong APPKEY when registering the node. Many users fill in "APPSKEY".
- Please note the distinction between "APPKEY" and "APPSKEY".
2)If the node works on the server for a period of time, the device stops working and receives a "MIC Mismatch" message.
The user needs a USB-TTL adapter to connect the serial port to modify the node APPKEY.
- If a node is registered with multiple servers, it may also cause the "mic mismatch" error.
3)Wrong Regional Parameters version selected
We generally use versions above 1.0.2
4)We have had cases where it was automatically fixed the next day despite no manual changes, probably a server side issue
11. Why I got the payload only with "0x00" or "AA=="?
Why sensor sends 0x00?
For: US915、AU915、AS923
Possible Case 1:
Sensor has ADR=1 enable and sensor need to reply server MAC command (ADR request) while sensor has DR=0.
Possible Case 2:
For the sensor which has Datalog Feature enable, the sensor will send TimeRequest MAC Command to sync the time. This Time Request will be sent once Sensor Join Network and Every 10 days. While they send such command with DR=0, sensor will send this command with 0x00 payload.
How to solve:
Solution:
-
Use the decoder to filter out this 0x00 packet. (Recommand)
-
Data rate changed from DR3 to DR5, increasing upload byte length
AT+ADR=0AT+DR=3Downlink:
[http:///docs/wiki/Configuration/end-node/at-commands-downlink/)
Some node decoders may not have the filter function, or you need decoders of other servers and formats. Please send an email to support@dragino.com
12. Why my Dev EUI and APP EUI is 0x000000000000, how to solve?
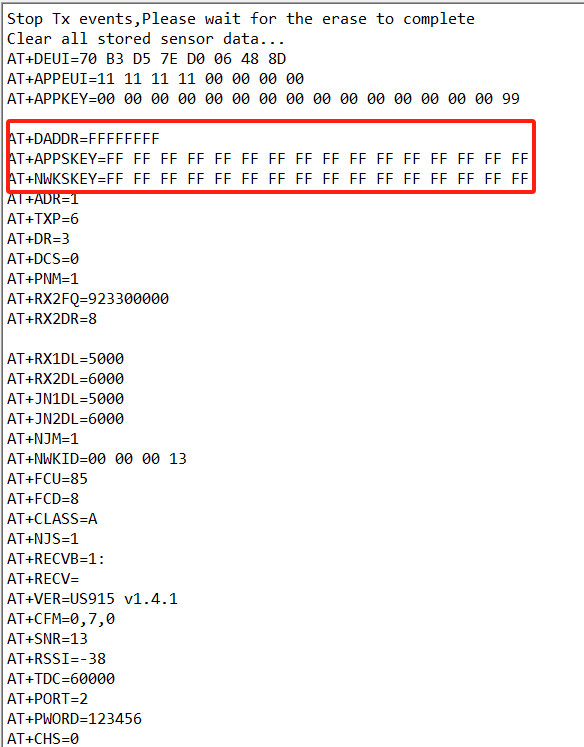
It is possible the keys is erased during upgrading of firmware. and the console output shows below after AT+CFG
AT+APPKEY=0000 00 00 00 00 00 00 00 00 00 00 00 00 00 00
AT+NWKSKEY=0000 00 00 00 00 00 00 00 00 00 00 00 00 00 00
AT+APPSKEY=0000 00 00 00 00 00 00 00 00 00 00 00 00 00 00
AT+APPEUI=0000 00 00 00 00 00 00
You can get the keys from the box sticker or send mail to Dragino Support to check keys with the provided SN number.
You can rewrites the keys by running commands in AT Console
For example:
AT+APPKEY=8541 47 20 45 58 28 14 16 82 A0 F0 80 0D DD EE
AT+NWKSKEY=AACC B0 20 30 45 37 32 14 1E 14 93 E2 3B 20 11
AT+APPSKEY=1123 02 20 30 20 30 60 80 20 20 30 30 20 10 10
AT+APPEUI=2C45 47 E3 24 12 23 24
(Any combination of 16 bit codes can be used)
13. I set my device is LoRaWAN Class C mode, why I still see Class A after boot?
Class C only refers to status after OTAA Join successfully. The OTAA Join Process will use Class A mode.
14. Why it takes longer time for OTAA joined in: US915、CN470、AU915
In: US915、AU915、CN470
In Dragino Sensors old version firmware (before early 2022), the sub-band is fixed the sub-band to 2 , but this cause a problem, the end node is hard to use in other subband and need program. So the new logic is as below:
We have improved this, the end node will use frequency 1 from sub-band1, then frequency 1 from sub-band2, then frequency 1 from sub-band3, etc to process the OTAA join, in this case, in this case, the end node can support LoRaWAN servers with different sub-bands. To make sure the end node will only transmit the proper sub-band after OTAA Joined successfully, the end node will:
-
Check what sub-band the LoRaWAN server ask from the OTAA Join Accept message and switch to that sub-band.
-
Use the Join successful sub-band if the server doesn't include sub-band info in the OTAA Join Accept message (TTN v2 doesn't include).
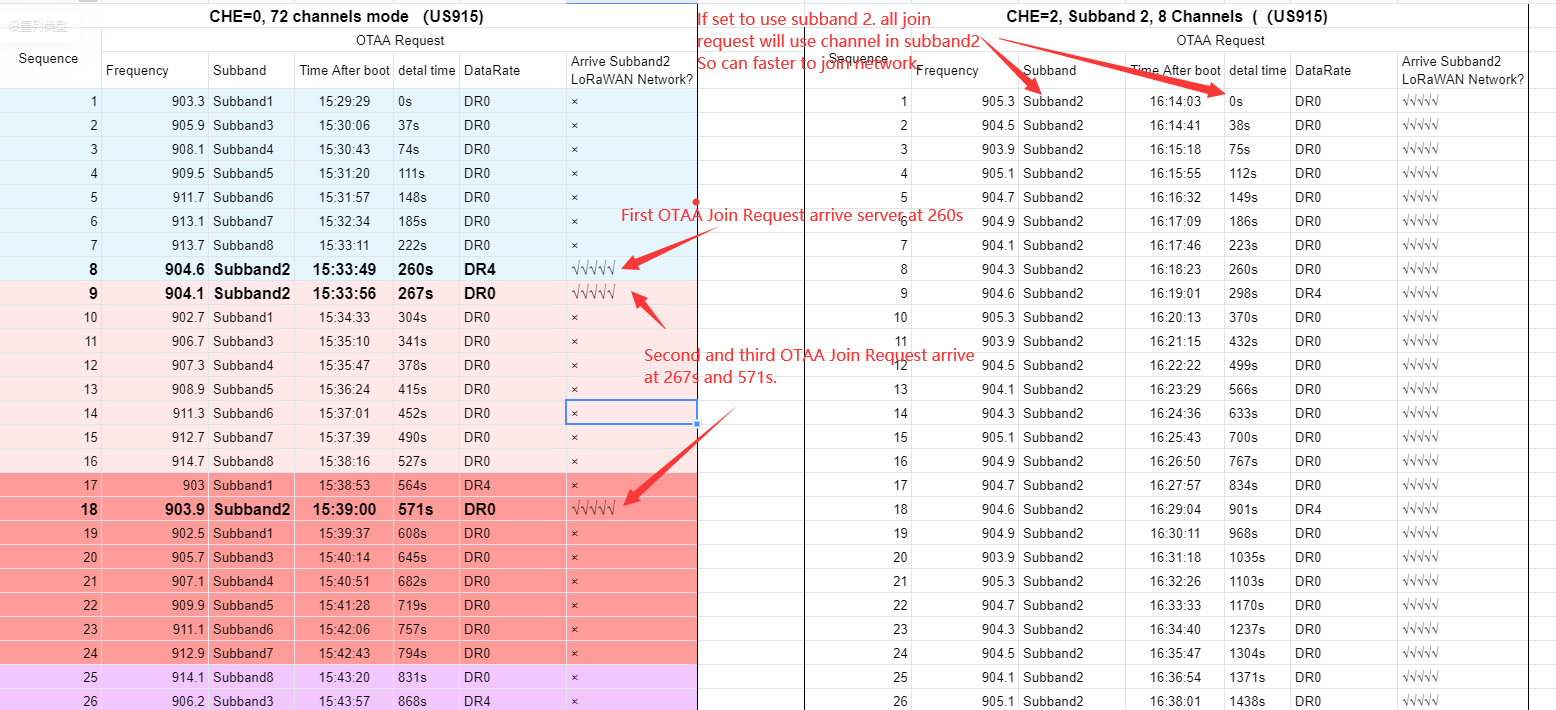
This change will make the activation time a little longer but make sure the device can be used in any sub-band.
Below is a photo to show why it takes longer time for OTAA Join. We can see in 72 channels mode, why it takes more time to join success. If users want to have faster OTAA Join success, he can change default CHE to the sub-band he uses.